It was not exactly a Valentine’s Day Massacre for President Joe Biden, but the latest US CPI (consumer price index) report fired off some economic flesh wounds for the American people. The annual inflation rate further eased, but it came in higher than expected, as the public continues to pay more for goods and services than they did a year ago and, in some cases, in the previous month. So, how much will your wallet hurt at the neighborhood supermarket or local gasoline station?
US CPI Is Sticky
The annual inflation rate eased to 6.4% in January, down from 6.5% in December, according to the Bureau of Labor Statistics (BLS). This came in higher than market estimates of 6.2%. The core inflation rate, which eliminates the volatile energy and food sectors, slipped to 5.6% last month, down from 5.7%. This was also worse than the forecasted 5.5%. On a month-over-month basis, the US CPI surged 0.5%, up from 0.1% in December. The core CPI also rose 0.4%, unchanged from the previous month and as expected by industry observers.
Here is a breakdown of the indexes based on annualized measurements:
- Food: +10.1%
- Energy: +8.7%
- New Vehicles: +5.8%
- Used Cars and Trucks: -11.6%
- Apparel: +3.1%
- Medical Care Commodities: +3.4%
- Shelter: +7.9%
- Transportation Services: +14.6%
- Medical Care Services: +3%
Some economists contend that it might be wise to start assessing the monthly movements in goods and services, as it might confirm if the disinflation process is traveling through the US economy or remaining entrenched in the national marketplace. By using this assessment, it does confirm that a broad array of US CPI items is still rising at an uncomfortable pace.
For example, supermarket prices are up 11.3% year-over-year and 0.5% month-over-month. Within the food-at-home category, eggs have surged at an annualized pace of 70.1% and a monthly rate of 8.5%. From December to January, rice soared by 1.4%, beef and veal rose by 1.1%, ham climbed by 3%, oranges spiked by 2.8%, margarine increased by 1.2%, and instant coffee swelled by 3.6%.
While there has been a considerable decline in the energy industry, many products and services have started to inch higher again. Gasoline prices rose 2.4%, electricity costs edged up 0.5%, and utility-piped gas services soared 6.7%. Although shelter costs are considered a lagging indicator by up to nine months, rents surged 8% from a year ago and 0.8% month-over-month. The owners’ equivalent rent of residence also jumped 0.7% from December to January.
Ultimately, the three things consumers need the most – energy, food, and shelter – are still highly elevated and showing signs of renewed growth. But what about everything else? This is the tricky part, especially for the Federal Reserve as it attempts to hit the pause button on rate hikes this spring.
Goods vs Services
The good news in the US CPI report is that the goods sector, which represents about one-third of the data, is generally easing. A wide range of products is falling or rising at a slower pace. For instance, it is 13.2% cheaper to buy a television and 3.9% less expensive to purchase major appliances today than it was 12 months ago.
 Now that the economy has fully reopened and broader conditions have relatively stabilized, the services sector, which accounts for roughly 60% of the inflation statistics, is witnessing the bulk of the price intensity. In January, services inflation rose to an annualized rate of 7.6%, up from 7.5%. This has been primarily driven by higher wage pressures and growing input costs endured by the providers.
Put simply, in recent months, consumers have shifted their consumption behaviors from goods to services. But, here is the kicker: If the US economy somehow averts a recession and the American people remain employed and maintain their pandemic-era savings (it is debated if these funds are still parked in their accounts or if they have been exhausted), goods inflation could be resuscitated in 2024, creating a vicious cycle.
Back to the ‘80s?
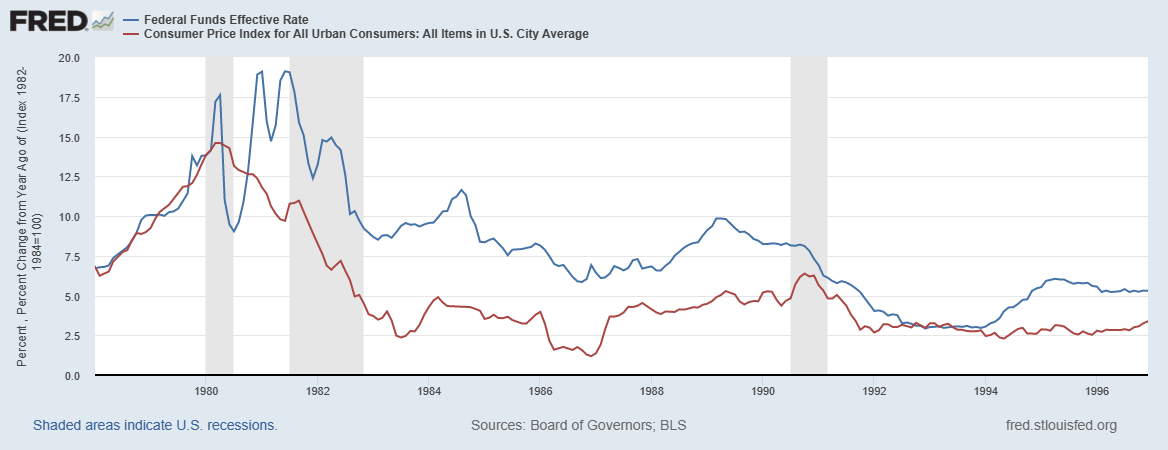
Will the US CPI return to 9.1% again? Probably not. Will the annual inflation rate remain elevated? The answer may rest in the classic Yogi Berra quote: “It’s Deja vu all over again.” In the early 1980s, inflation soared thanks to the guns and butter of the 1960s and 1970s. While it topped out at 13.55% and appeared to be over by 1986 when it declined to 1.9%, the inflationary monster kept rearing its ugly head in the years to come: 3.66% in 1987, 3.08% in 1988, 4.83% in 1989, 5.4% in 1990, 4.24% in 1991, and 3.03% in 1992. The Federal Reserve had started trimming the benchmark fed funds rate after inflation peaked, but it was forced to raise interest rates in response to the routine year-over-year increase in the US CPI.
The financial markets are betting that the Eccles Building will cut rates later this year in response to slowing economic growth and a potential recession. But what if inflation repeats the trends of the late 1980s and early 1990s? Chair Jerome Powell – or his successor – may need to maintain the central bank’s tightening campaign, much to the chagrin of the easy-money junkies of Wall Street and Washington.


